> ## Documentation Index
> Fetch the complete documentation index at: https://docs.agentbase.sh/llms.txt
> Use this file to discover all available pages before exploring further.
# Traces
> Debug and understand agent behavior with execution traces
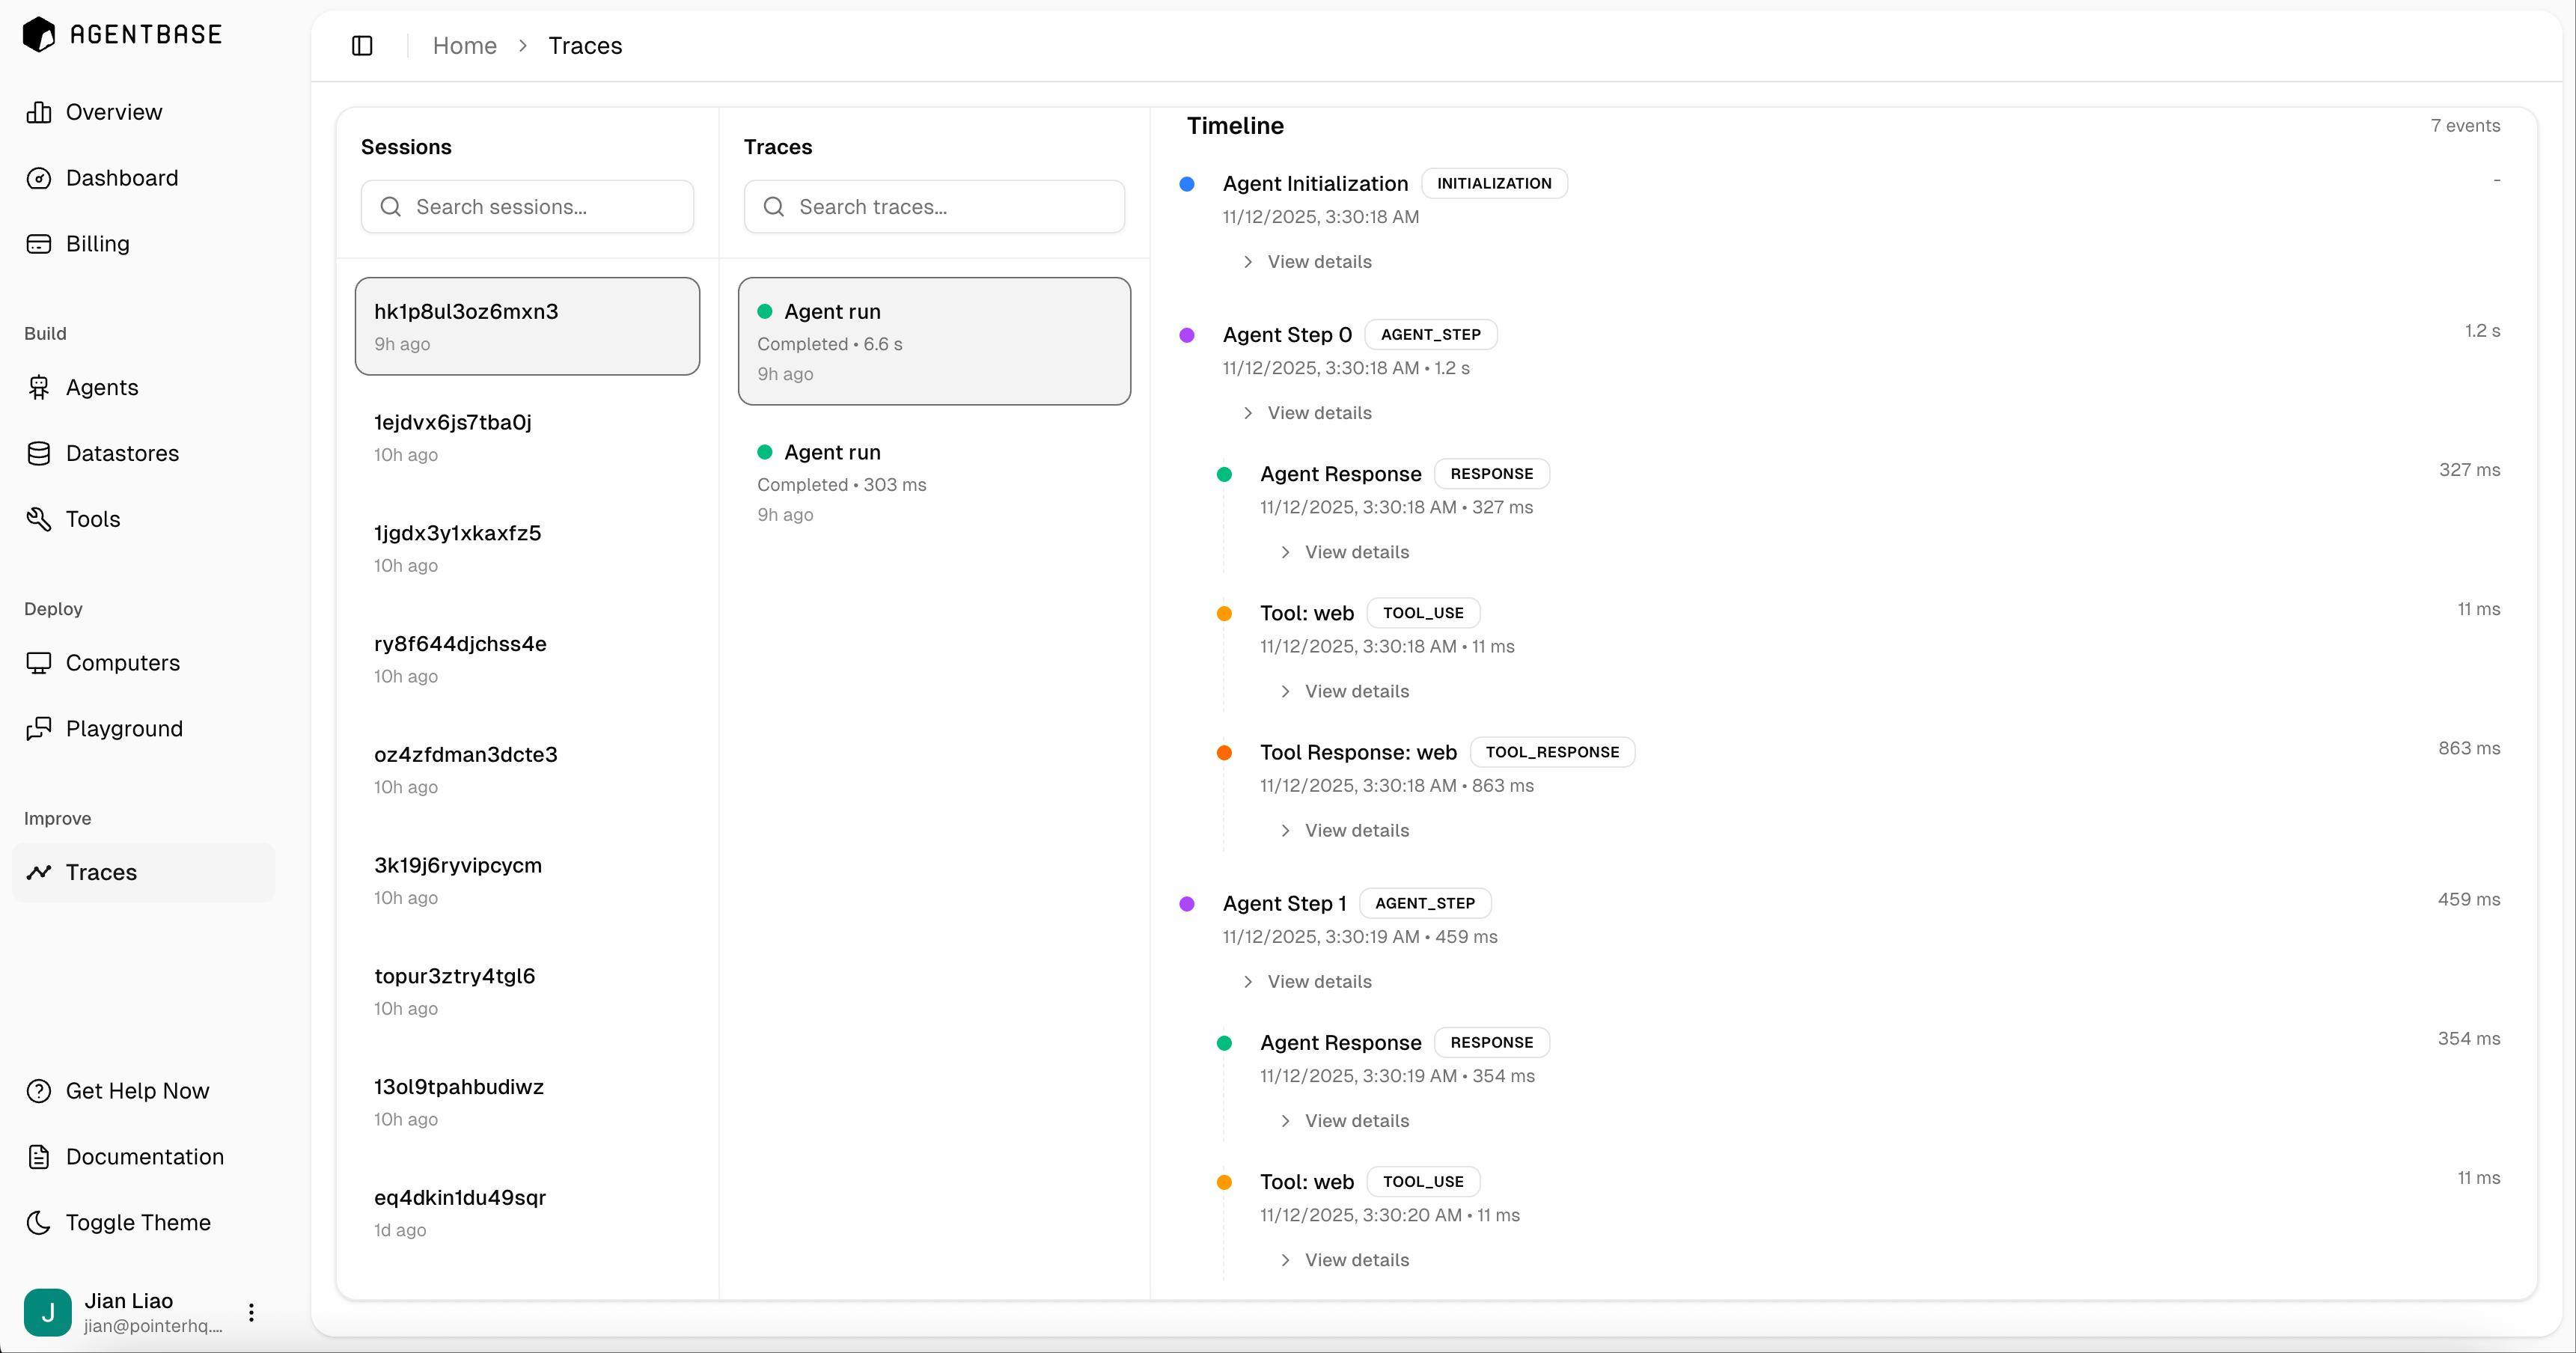
Traces provide detailed execution logs of your agent's behavior, helping you debug issues, optimize performance, and understand how your agent processes requests.
 ## What are Traces?
Traces are comprehensive execution logs that capture every step of your agent's workflow, including:
* **Agent Initialization**: When the agent starts processing a request
* **Agent Steps**: Each reasoning step the agent takes
* **Tool Usage**: When and how the agent uses tools
* **Tool Responses**: Results returned from tool executions
* **Agent Responses**: Final responses generated by the agent
Each event in the trace includes:
* Timestamp of when it occurred
* Duration of execution
* Detailed information about inputs and outputs
* Status (completed, in progress, failed)
## Accessing Traces
Navigate to the **Traces** page in your Agentbase dashboard under the **Improve** section. Here you'll find:
1. **Sessions**: A list of all agent execution sessions with unique session IDs
2. **Traces**: Individual agent runs within each session
3. **Timeline**: A chronological view of all events in a trace
## Using Traces for Debugging
Traces are invaluable for:
* **Performance Optimization**: Identify slow steps or tool calls by examining execution durations
* **Error Diagnosis**: Pinpoint where failures occur in your agent's workflow
* **Behavior Analysis**: Understand the reasoning path your agent takes
* **Tool Usage Monitoring**: See which tools are being called and how often
* **Response Quality**: Review agent responses and the context that led to them
## Trace Events
### Agent Initialization
Records when the agent begins processing a request, including the initial prompt and configuration.
### Agent Steps
Each step represents a discrete reasoning action by the agent. Steps are numbered sequentially (Step 0, Step 1, etc.) and show:
* The agent's thought process
* Decisions about which tools to use
* Planning for next actions
### Tool Events
Tool usage is captured in two events:
* **Tool: \[name]** - When a tool is invoked, showing the tool name and parameters
* **Tool Response: \[name]** - The result returned by the tool execution
### Agent Response
The final response generated by the agent after completing all necessary steps.
## Best Practices
Use traces during development to validate that your agent is using tools correctly and following expected reasoning patterns.
* **Regular Monitoring**: Review traces periodically to catch issues early
* **Performance Tracking**: Compare execution times across different agent modes
* **Error Patterns**: Look for recurring failures to identify systemic issues
* **Tool Optimization**: Analyze tool usage patterns to optimize your tool implementations
Traces are automatically captured for all agent runs. You can search and filter traces by session ID, time range, or status to find specific executions.
## What are Traces?
Traces are comprehensive execution logs that capture every step of your agent's workflow, including:
* **Agent Initialization**: When the agent starts processing a request
* **Agent Steps**: Each reasoning step the agent takes
* **Tool Usage**: When and how the agent uses tools
* **Tool Responses**: Results returned from tool executions
* **Agent Responses**: Final responses generated by the agent
Each event in the trace includes:
* Timestamp of when it occurred
* Duration of execution
* Detailed information about inputs and outputs
* Status (completed, in progress, failed)
## Accessing Traces
Navigate to the **Traces** page in your Agentbase dashboard under the **Improve** section. Here you'll find:
1. **Sessions**: A list of all agent execution sessions with unique session IDs
2. **Traces**: Individual agent runs within each session
3. **Timeline**: A chronological view of all events in a trace
## Using Traces for Debugging
Traces are invaluable for:
* **Performance Optimization**: Identify slow steps or tool calls by examining execution durations
* **Error Diagnosis**: Pinpoint where failures occur in your agent's workflow
* **Behavior Analysis**: Understand the reasoning path your agent takes
* **Tool Usage Monitoring**: See which tools are being called and how often
* **Response Quality**: Review agent responses and the context that led to them
## Trace Events
### Agent Initialization
Records when the agent begins processing a request, including the initial prompt and configuration.
### Agent Steps
Each step represents a discrete reasoning action by the agent. Steps are numbered sequentially (Step 0, Step 1, etc.) and show:
* The agent's thought process
* Decisions about which tools to use
* Planning for next actions
### Tool Events
Tool usage is captured in two events:
* **Tool: \[name]** - When a tool is invoked, showing the tool name and parameters
* **Tool Response: \[name]** - The result returned by the tool execution
### Agent Response
The final response generated by the agent after completing all necessary steps.
## Best Practices
Use traces during development to validate that your agent is using tools correctly and following expected reasoning patterns.
* **Regular Monitoring**: Review traces periodically to catch issues early
* **Performance Tracking**: Compare execution times across different agent modes
* **Error Patterns**: Look for recurring failures to identify systemic issues
* **Tool Optimization**: Analyze tool usage patterns to optimize your tool implementations
Traces are automatically captured for all agent runs. You can search and filter traces by session ID, time range, or status to find specific executions.